Sunday, November 6, 2016

Scales of the Universe

Scale of the Universe Interactive demo
Link to online demo HERE.

Homework table to be completed by you using this Interactive Demo can be found HERE.

It's OK to look up 'trillion' in scientific notation and vice versa if you're unfamiliar with these terms.

DUE Monday, 11/14

Tuesday, November 1, 2016

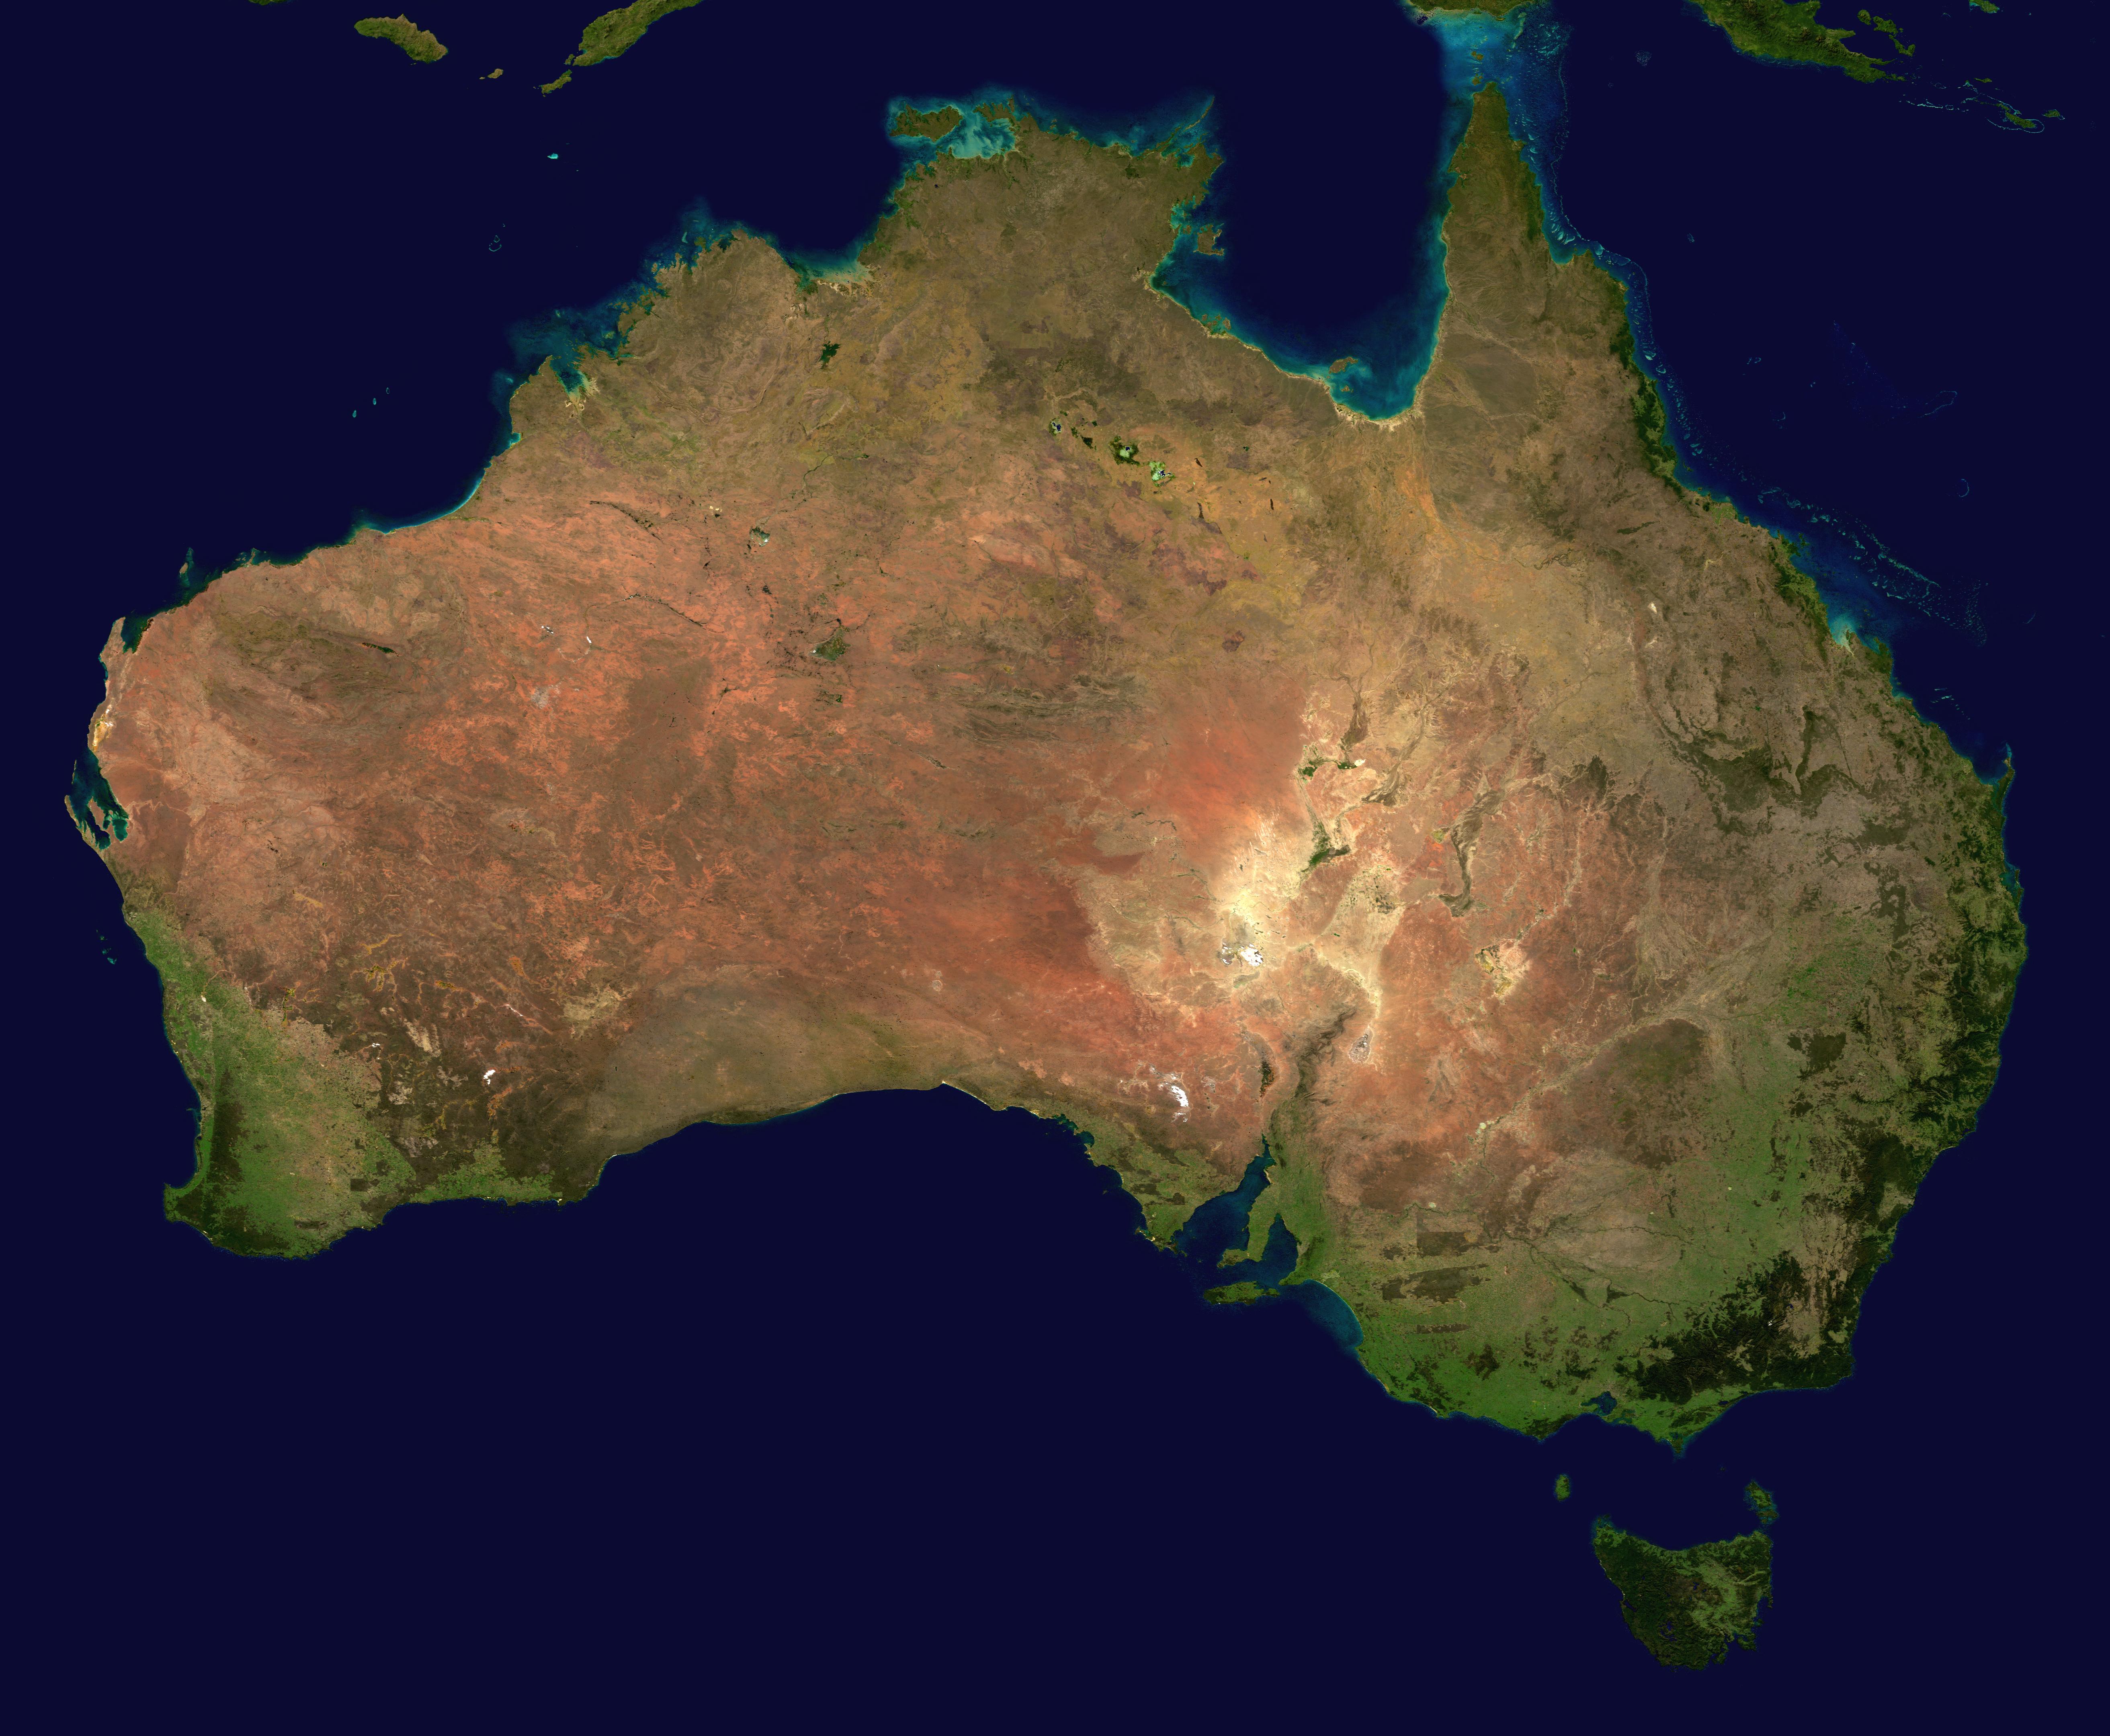
Google Earth: Australia plots

Today- look at several plots- try to find some from different looking areas.
1. open google Earth.
2. download this KMZ file.
3. open this KMZ file.

AUSTRALIA PLOTS KMZ file

How hard is it to count the trees?
How many plots would you consider 'reasonable' for one lab team to count?
How many times do you think each plot should be counted? Why?

Tuesday, October 25, 2016

Succession

mt. st. helens.  Lupine is a nitrogen fixer.

Succession is a predictable changes in an ecosystem that happen when an area has no life (post lava flow, glacier retreats, for example) OR when there has been a severe disturbance (forest fire).  Each stage in a succession makes conditions better for the following stages.
Khan Academy Video: Ecological Succesion


Ecological Succession: Encyclopedia Brittanica


Oregon post-fire 2003 B&B fire

Mt. St. Helens with Earth Observatory photos

Monday, October 24, 2016

Logbook check 10/31

Some classes didn't have owl ecosystem questions.  
It's OK if your page#s don't match mine- 
as long as these assignments are in your logbook, completed, 
AND in as close to this order as possible. 

Thursday, October 20, 2016

How Wolves Changed Rivers


How Wolves Change Rivers

Criticism of Wolves Change Rivers Story
http://www.nytimes.com/2014/03/10/opinion/is-the-wolf-a-real-american-hero.html?smid=tw-share&_r=1
http://www.nature.com/news/rethinking-predators-legend-of-the-wolf-1.14841

Predator/Prey Modeling Follow up questions (Deer Me Game)

Deer Me Follow up questions: 

(everyone should have their own Data, Graph AND answers to these questions, in your own words).

1. Graph your results.  Include axis labels and a key.
2. Summarize your deer/wolf predator/prey interactions in a sentence or two.
Example: The deer and wolves reached an equilibrium- as the number of deer went up, so did the wolves, but then when the wolves reached a big enough number, the deer started to go down.  Then the number of wolves went down, and once the wolf numbers were low enough, the deer population rebounded.
3. What factors could you change that would affect this model?  What effect do you predict they would have.  Give 3.
Example: if wolves had only had to catch one deer to survive, the deer population would have been kept at much lower numbers.
4. What equation do you think best fits the graph you have drawn.  Write it below.  (HINT: this is kind of a trick question- but- if there's even part of your graph that fits some math you've learned, please write about it).
5. If I were to use this simulation game again with next year's Biology Students, what would make it go better?